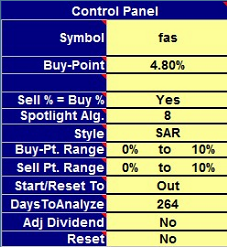
The control panel is where you specify which stock to examine, and set the spotlight on the particular algorithm you wish to view detailed performance metrics on.
Algorithm Science
Trading Strategy Discovery
In the spreadsheet, click on dark blue cells for HELP
Symbol
Enter a stock symbol in the yellow box and press ENTER. The spreadsheet will fetch one year of "end of day" Open, High, Low, Close data for analysis. If the symbol is not listed on the NYSE, NASDAQ or AMEX exchanges, you follow the symbol by a dot, then the exchange code. See exchange codes.
Examples of valid symbols would be:
F Ford Motor Company (NYSE)
TSCO.L Tesco (PLC)--London Stock Exchance
R.TO Romarco Minerals (Toronto Stock Exchange)
2330.TW Taiwan Semiconductor Manufacturing (Taiwan Exchange)
EURUSD=x Euro/US Dollar (Currency)
XSIIX Ing Senior Income I (Mutual Fund)
If you enter a mutual fund symbol, remember that mutual fund prices only change once a day, which limits the algorithms available to you.
PriceDelta fetches two tables, the historic price data and split/dividend data. It can take a few seconds. This is the only interaction PriceDelta has with external sites, except for these links to the help pages. Once the data is loaded it is checked for certain errors and any corrections are flagged and you can check it by looking at the Strategy or Analysis tab.
Light yellow cells are for USER INPUT
Buy-Point and Sell-Point
Buy and sell points are signal trigger points a fixed percentage above or below a reference price. When the price hits the buy or sell point a transaction may follow. PriceDelta scans though a hundred buy-sell points and graphs the results for each of eight algorithms. Interesting algorithms can be "spotlighted" by the user by typing the buy and sell points here so that the spotlighted results are presented at the top of the Results page.
The Sell-Point is the same as the buy point in the example shown. If they are different the Sell-Point will be shown on the control panel. In the example shown above, the Buy Point and Sell Points are set to 4.8%.
Sell % = Buy %
If you set "Sell % = Buy %" to "Yes", the sell point is forced to be equal to the buy point for every one of the 100 buy points analyzed. If set it to "No", the sell-point is fixed (to 1.2% in this example) while the buy-point is scanned, (0, 0.2%, 0.4% etc. up to 20%) and the buy-point is fixed (here at 1.00%) while the sell point is scanned. You will usually start a search by setting Sell % = Buy % to "Yes".
Spotlight Alg
Set the number here to the number of the algorithm you wish to spotlight. The number and name of the algorithm is given in the "Algorithm Names" panel. The Performance Table, the Growth graph and the Trade Point graph will now reflect the spotlighted algorithm
Style
The basic investment styles are "Long", "Short" and "SAR" (stop and reverse). In the SAR investment style you are always in the market, either long or short. The style is selected in this box. Other investment styles are available: EMA, SMA, Price, Algorithm based or user defined. See here for details
Buy-point and Sell-point Range
When scanning the algorithms, the buy-point and sell point are set to 100 values, constrained by the range entered here. For example, if the range was set to 0 to 20%, the scan would start with buy-point 0%, then 0.2%, 0.4% etc, up to 20%. The range will appear on the x axis of each of the three "Results vs. Buy Point" and the three "Results vs. Sell Point" graphs. Ranges can include negative numbers.
Start/Reset to
You specify here how you wish the algorithms to start out on day one, either "long", "short" or "out". If you have specified a Reset (see below) at the close or open, the algorithm will always reset to the state specified at the close or open.
Days to Analyze
Determines how many days to include in the backtesting. Can be in the range 2 to 264. Reducing the range provides a good way to see how an algorithm has been performing in recent times. Note there are typically 252 trading days a year.
Adj Dividend
PriceDelta will adjust prices for splits, as long as the split table was available from the provider. If you also want the program to adjust prices for dividends, you may request it to do so here.
Reset
You can set up the algorithms so they reset either at every open or close the value set up in the "Start/Reset to" cell above. Applying a reset means that the algorithm will start each day in the same state, "Long", "Short" or "Out".