

Algorithm Science
Trading Strategy Discovery
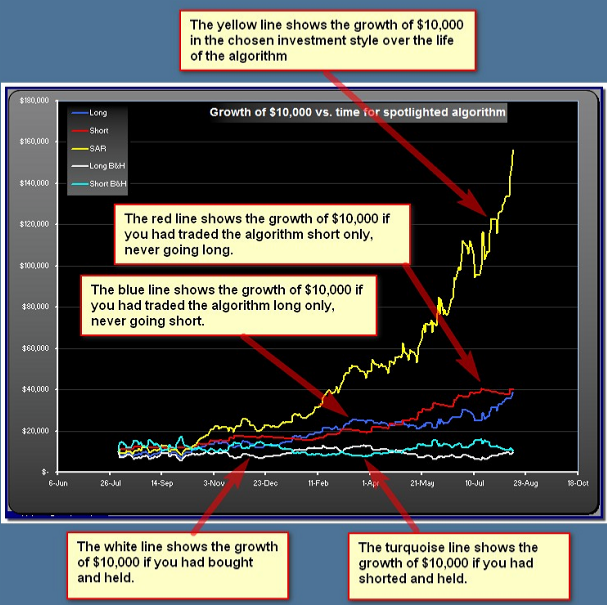
The Growth graph shows how $10,000 would have grown if invested in the spotlighted algorithm. The graphs assume that profits from all trades are re-invested in the algorithm (the returns are compounded). We show the long-side, short-side and combined returns, and for comparison we also show buy-and-hold and short-and-hold returns. We don't include any trading transaction costs in the calculations.
The X axis will stretch for however many trading days of data are being analyzed, the default being 264, if 264 days of data are available from the web. You can change the range from the Control Panel.
When the graph points vertically upwards, as it does here, it indicates that the algorithm has been working well in recent weeks, however you should also check the longievity graphs to confirm.