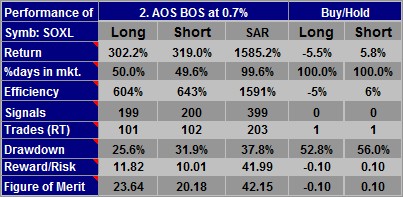


The performance table gives detailed performance for the spotlighted algorithm. Here's an example:

Algorithm Science
Trading Strategy Discovery
We show the performance for the Long and Short side of the algorithm. Long will show the performance if you had just bought and sold and never went short. Short shows the performance if you had only sold short and covered and never gone long. The third column shows the performance for the selected Style, in this case SAR, in which you are always either long or short. For comparison purposes we also show Buy and Hold performance for both Long and Short.
Symb
In this example, the stock symbol is SOXL.
Return
The compounded return for the strategy. This is the return if all profits or losses had been re-invested. It is measured over the period of the algorithm (in the Days to Analyze control) so is not annualized. In the example shown, the SAR return is much higher than the individual Long or Short return for the algorithms. This is because the combined compounded return will be (1+Long Ret)*(1+Short Ret)-1, ie 4.022*4.19-1=15.85, or 1585%. If you wish to know the simple returns, please refer to the Analysis tab. Trading costs are not included.
%days in mkt.
The percentage of days where a position was held. If a position was held for a partial day, it is counted as one full day, unless both a long and short position was held on a particular day, in which case 0.5 days is assigned to each. Refer to the Analysis tab in the "Days in Mkt" column to understand how this figure was arrived at. The figure is an approximation and tends to be higher than the actual percentage of time positions were held. You can optionally switch to showing "%Time in mkt" instead of "%Days in mkt", see the Other Settings help page.
Efficiency
The compounded return divided by the %days in mkt. It represents the hypothetical return if you could have invested with the same rate of return for 100% of the time. (Note that compounding would increase this hypothetical return even higher).
Signals
The number of buy (long) and sell (short) signals. Not every signal leads to a trade, for example if a buy signal comes along and the algorithm is already long, then no buy will occur.
Trades (RT)
The number of round trip trades. Each long trade is one buy and one sell. Each short trade is one short sell and one cover. A single reversal, long to short or short to long counts as one round trip trade.
Drawdown
The greatest loss you could have incurred had you bought on a peak and sold on a subsequent trough. We use this as a measure of risk. Lower is better.
Reward/Risk
The compounded return divided by the drawdown. Higher is better.
Figure of Merit
The reward/risk divided by the %days in market (also the Efficiency divided by by the drawdown). An indication of the relative merit of an algorithm, but not to be taken too seriously. Algorithms with zero drawdown or low %time in mkt can have high figures of merit, but in reality would be of limited merit. Higher is better.
