


Algorithm Science
Trading Strategy Discovery
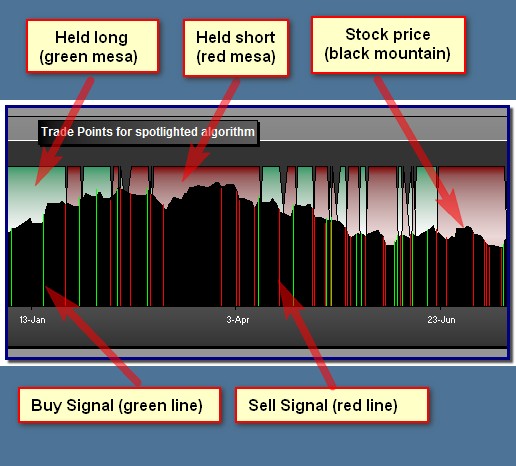
The Trade Point graph shows where in time signals occured and positions were held, as well as showing the stock price over the period of interest. Not all signals lead to a trade. It is not meant to be an accurate depiction, but it can help you see if an algorithm's behavior was sane, and where signals were either missing or excessive. For exact details of the trades made and the execution prices, refer to the tables either the Analysis tab or the Strategy tab.