

Algorithm Science
Trading Strategy Discovery
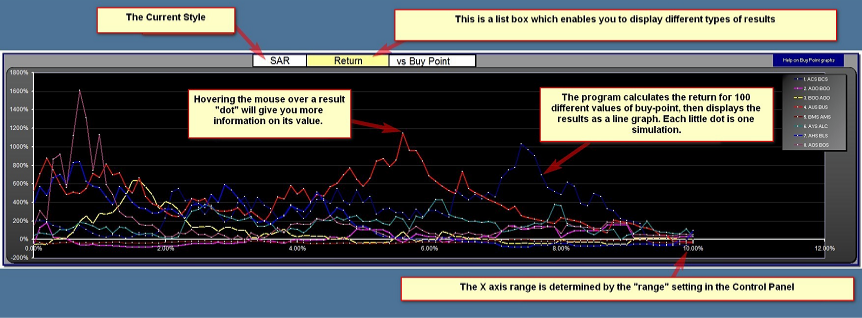
The Buy and Sell-point graphs show algorithm results for different buy-points and sell-points as they are scanned over the ranges you set in the Control Panel. If the "buy%=sell%" box is set to "Yes" in the Control Panel, all the information is in the Buy-point graphs and the Sell-Point graphs are not active. If the "buy%=sell%" box is set to "No", the buy-points are scanned with the sell point held constant and the sell point is scanned with the buy-point held constant.
You can click in the yellow list-box on top of the graph to change the type of result displayed. There are three graphs for buy-point scans, the top two can be set to display Return, %time in mkt, Drawdown or Efficiency. The bottom graph can display Number of Signals, Number of trades, Figure of Merit or Reward Risk. You must press F9 to recalculate if you change this setting. Similarly there are three graphs for Sell-Point scans.
Any time you see the message
you should press F9 to force a recalculation. This can happen if you change things in the control panel. It can take around 20 seconds to recalculate, depending on the speed of your computer.
To reduce the number of graphs visible, you can hide their columns on the Buy Table or Sell Table tabs.
Its OK to set the range to a negative value such as -5% to 5%, in fact there is often good information there if you are using High or Low as your reference prices.